Pending Workloads in Grafana
This guide explains how to monitor pending workloads in Grafana using the VisibilityOnDemand feature.
The intended audience for this page are batch administrators for ClusterQueue visibility, and batch users for LocalQueue visibility.
Before you begin
Make sure the following conditions are met:
- A Kubernetes cluster is running.
- Kueue is installed
- Kube-prometheus operator is installed in version v0.15.0 or later.
- The VisibilityOnDemand feature is enabled.
Setting Up Grafana for Pending Workloads
Step 1: Configure Cluster Permissions
To enable visibility, create a ClusterRole and ClusterRoleBinding for either ClusterQueue or LocalQueue:
- For
ClusterQueuevisibility:
apiVersion: rbac.authorization.k8s.io/v1
kind: ClusterRole
metadata:
  name: grafana-cluster-queue-reader
rules:
  - apiGroups: ["visibility.kueue.x-k8s.io"]
    resources: ["clusterqueues/pendingworkloads"]
    verbs: ["get", "list", "watch"]
  - apiGroups: ["kueue.x-k8s.io"]
    resources: ["clusterqueues"]
    verbs: ["get", "list", "watch"]
---
apiVersion: rbac.authorization.k8s.io/v1
kind: ClusterRoleBinding
metadata:
  name: grafana-cluster-queue-reader-binding
subjects:
  - kind: ServiceAccount
    name: default
    namespace: default
roleRef:
  kind: ClusterRole
  name: grafana-cluster-queue-reader
  apiGroup: rbac.authorization.k8s.io
- For
LocalQueuevisibility:
apiVersion: rbac.authorization.k8s.io/v1
kind: ClusterRole
metadata:
  name: grafana-local-queue-reader
rules:
  - apiGroups: ["visibility.kueue.x-k8s.io"]
    resources: ["localqueues/pendingworkloads"]
    verbs: ["get", "list", "watch"]
  - apiGroups: ["kueue.x-k8s.io"]
    resources: ["localqueues"]
    verbs: ["get", "list", "watch"]
  - apiGroups: [""]
    resources: ["namespaces"]
    verbs: ["get", "list", "watch"]
---
apiVersion: rbac.authorization.k8s.io/v1
kind: ClusterRoleBinding
metadata:
  name: grafana-local-queue-reader-binding
subjects:
  - kind: ServiceAccount
    name: default
    namespace: default
roleRef:
  kind: ClusterRole
  name: grafana-local-queue-reader
  apiGroup: rbac.authorization.k8s.io
Apply the appropriate configuration:
kubectl apply -f <filename>.yaml
Step 2: Generate a Service Account Token
Create a token for Grafana authentication:
TOKEN=$(kubectl create token default -n default)
echo $TOKEN
Save the token for use in Step 5.
Step 3: Set up port forwarding for Grafana
Access Grafana locally:
kubectl port-forward -n monitoring service/grafana 3000:3000
Grafana is now available at http://localhost:3000.
Step 4: Install the Infinity Plugin
- Open Grafana at http://localhost:3000.
- Log in (default credentials: admin/admin).
- Go to
Connections>Add new connection. - Search for
Infinityand clickInstall.
Step 5: Configure the Infinity Data Source
- Go to
Connections>Data sourcesand click+ Add new data source. - Select
Infinity. - Configure the data source:
- Authentication: Set the
Bearer Tokento the token generated in Step 2. - Network: Enable
Skip TLS Verify. - Security: Add
https://kubernetes.default.svcto allowed hosts and setQuery securitytoAllowed.
- Authentication: Set the
- Click
Save & testto verify the configuration.
Step 6: Import the Pending Workloads Dashboard
- Download the appropriate dashboard JSON:
- In Grafana, go to
Dashboards>New>Import. - Select
Upload dashboard JSONfile and choose the downloaded file. - Select the Infinity data source configured in Step 5.
- Click
Import.
Step 7: Set Up ClusterQueue
To configure a basic ClusterQueue, apply the following:
apiVersion: kueue.x-k8s.io/v1beta2
kind: ResourceFlavor
metadata:
  name: "default-flavor"
---
apiVersion: kueue.x-k8s.io/v1beta2
kind: ClusterQueue
metadata:
  name: "cluster-queue"
spec:
  namespaceSelector: {} # match all.
  resourceGroups:
  - coveredResources: ["cpu", "memory"]
    flavors:
    - name: "default-flavor"
      resources:
      - name: "cpu"
        nominalQuota: 9
      - name: "memory"
        nominalQuota: 36Gi
---
apiVersion: kueue.x-k8s.io/v1beta2
kind: LocalQueue
metadata:
  namespace: "default"
  name: "user-queue"
spec:
  clusterQueue: "cluster-queue"
Apply the configuration:
kubectl apply -f https://kueue.sigs.k8s.io/examples/admin/single-clusterqueue-setup.yaml
Step 8: Create Sample Workloads
To populate the dashboard with data, create sample jobs:
apiVersion: batch/v1
kind: Job
metadata:
  generateName: sample-job-
  namespace: default
  labels:
    kueue.x-k8s.io/queue-name: user-queue
spec:
  parallelism: 3
  completions: 3
  suspend: true
  template:
    spec:
      containers:
      - name: dummy-job
        image: registry.k8s.io/e2e-test-images/agnhost:2.53
        command: [ "/bin/sh" ]
        args: [ "-c", "sleep 60" ]
        resources:
          requests:
            cpu: "1"
            memory: "200Mi"
      restartPolicy: Never
Apply the job multiple times:
for i in {1..6}; do kubectl create -f https://kueue.sigs.k8s.io/examples/jobs/sample-job.yaml; done
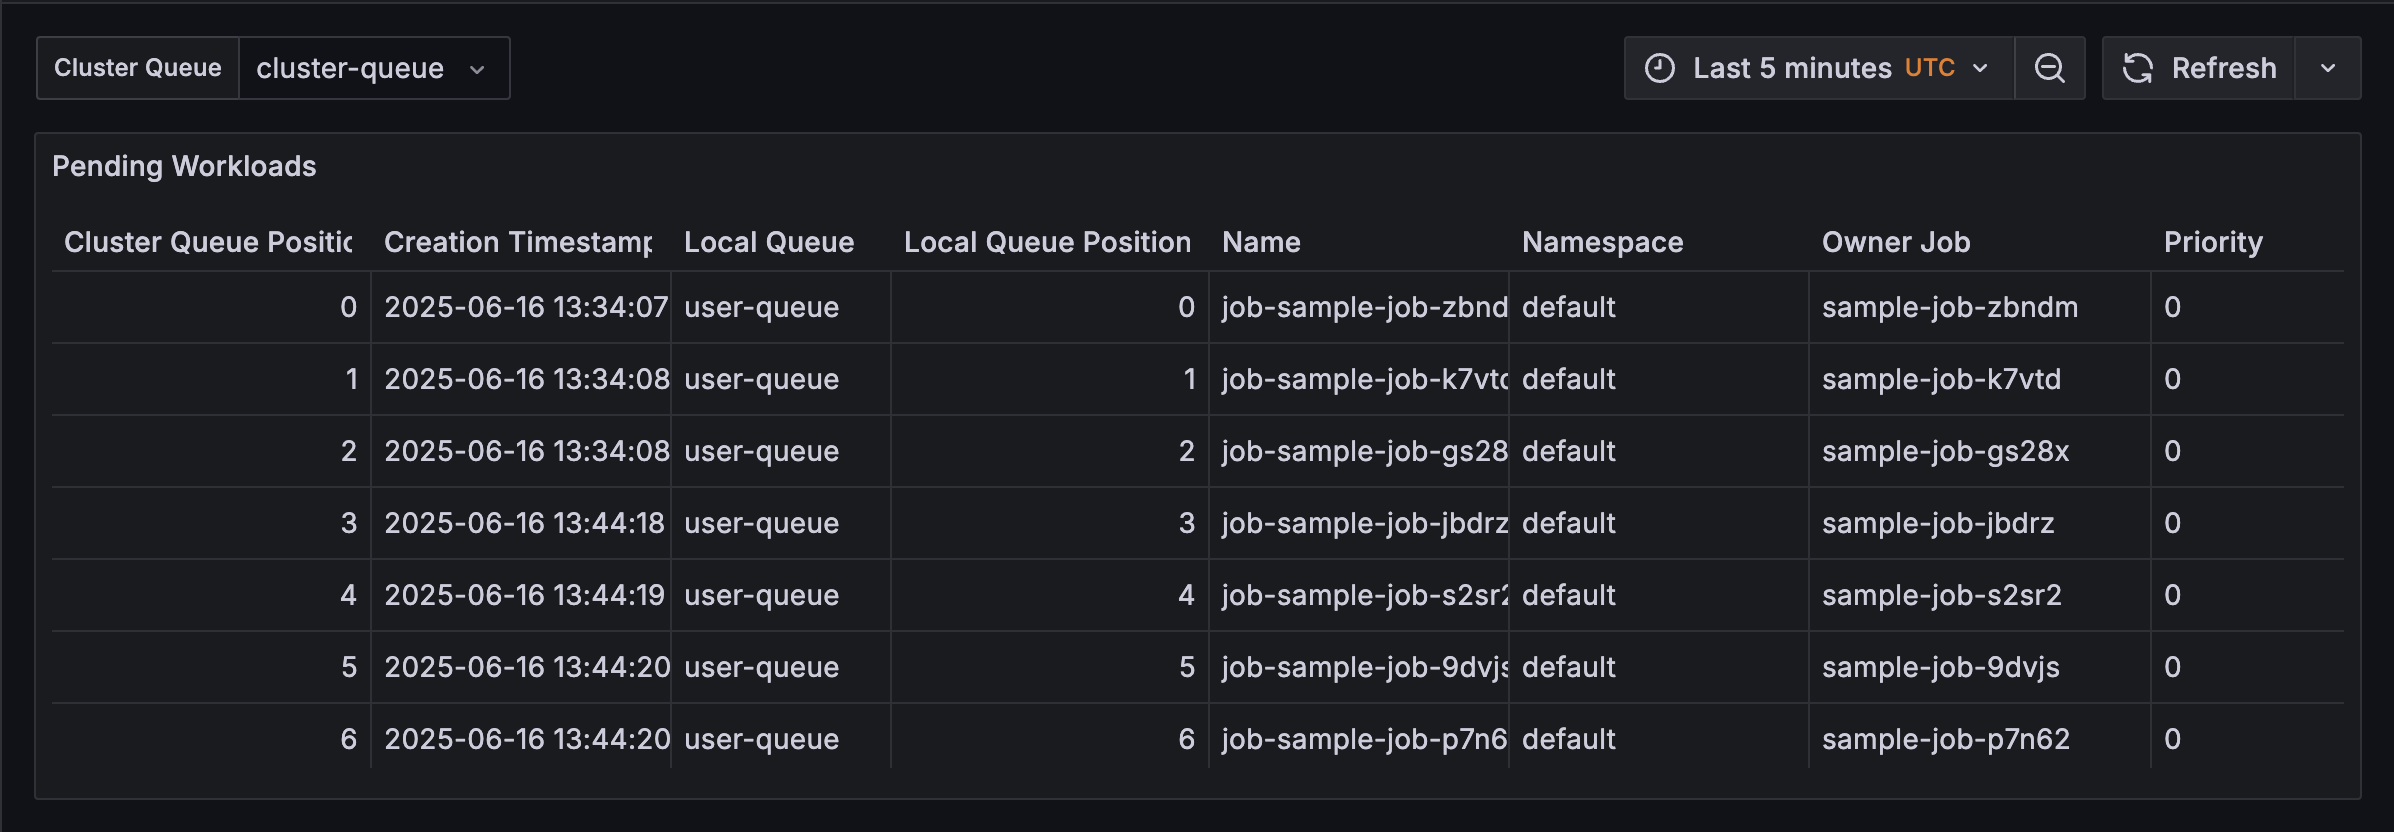
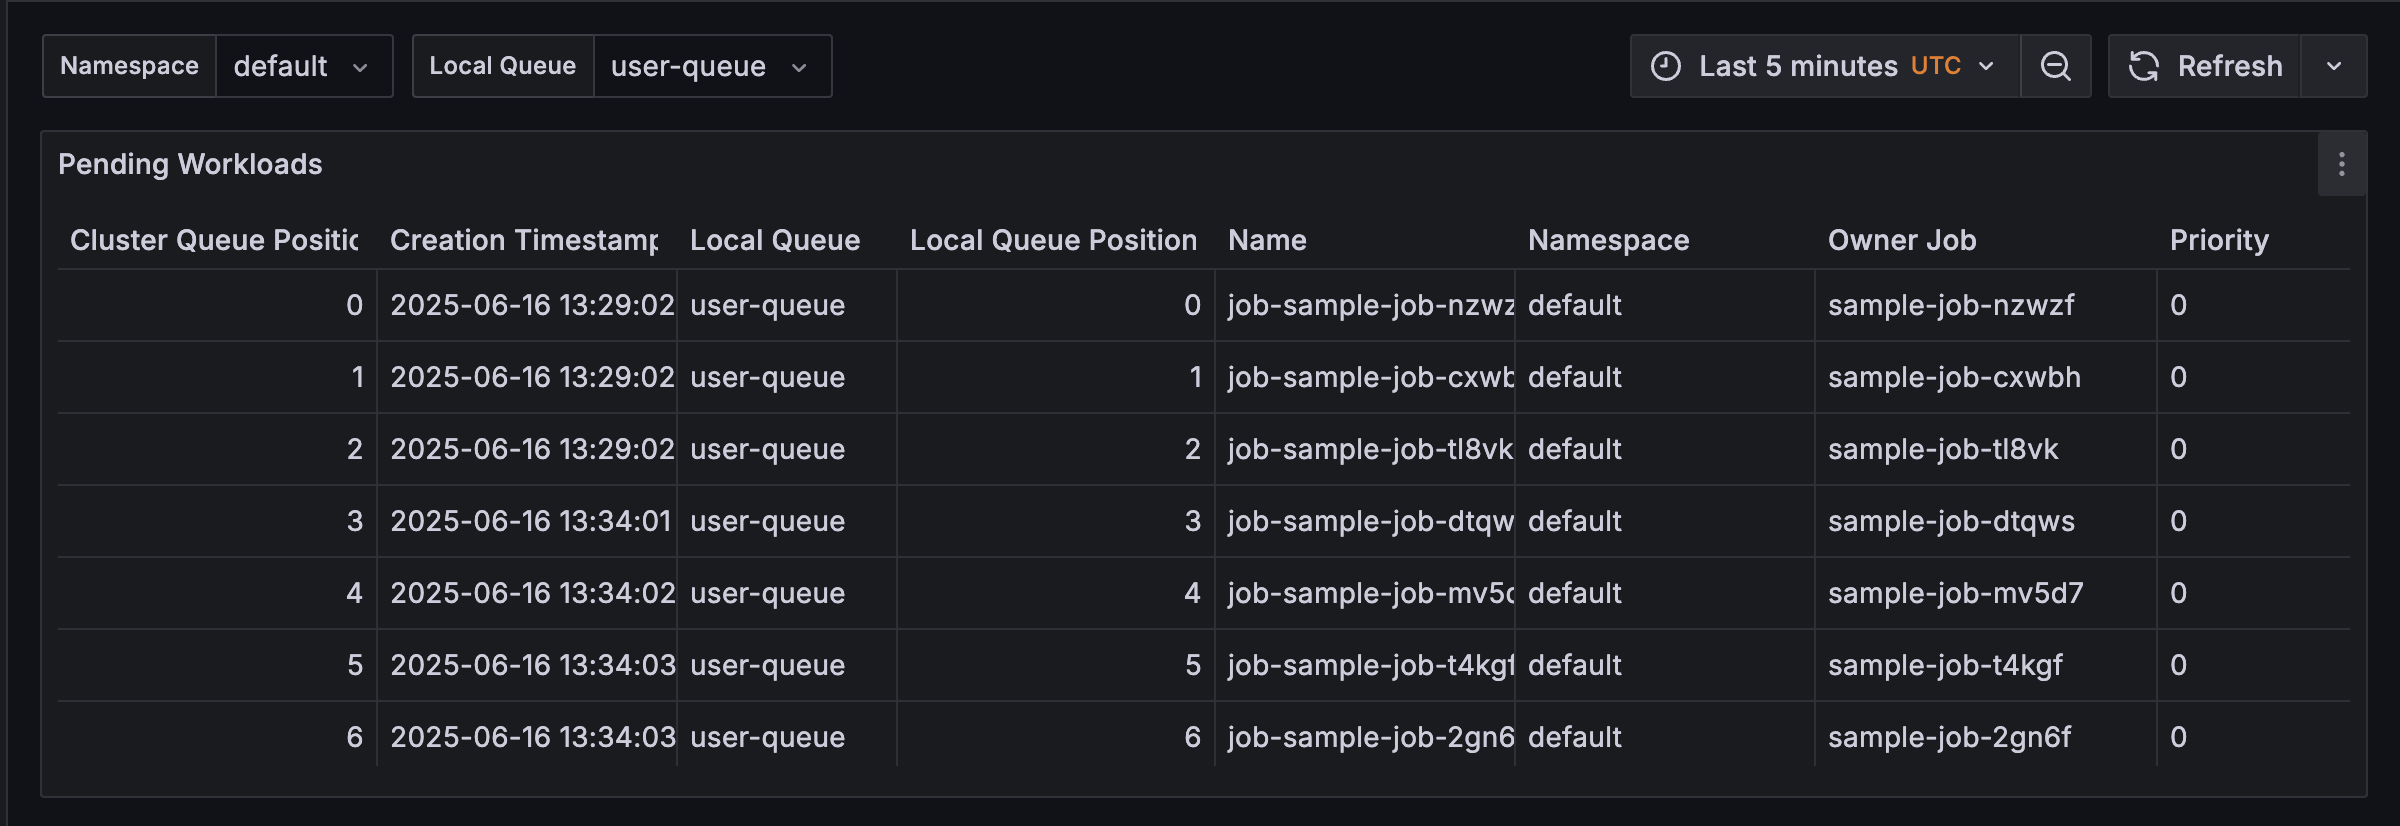
Step 9: View the Dashboard
- In Grafana, navigate to
Dashboards. - Select the imported dashboard (e.g., “Pending Workloads for ClusterQueue visibility”).
- Verify that pending workloads are displayed.
Troubleshooting
No data in dashboard
Ensure jobs are created and the Infinity data source is correctly configured.
Permission errors
Verify the ClusterRole and ClusterRoleBinding are applied correctly.
Grafana inaccessible
Check port forwarding and ensure the Grafana service is running in the monitoring namespace.
Feedback
Was this page helpful?
Glad to hear it! Please tell us how we can improve.
Sorry to hear that. Please tell us how we can improve.